Built for how consulting firms actually work
Every feature in rubiflow was designed to solve real problems faced by IT consulting and software companies managing distributed teams and multiple projects.
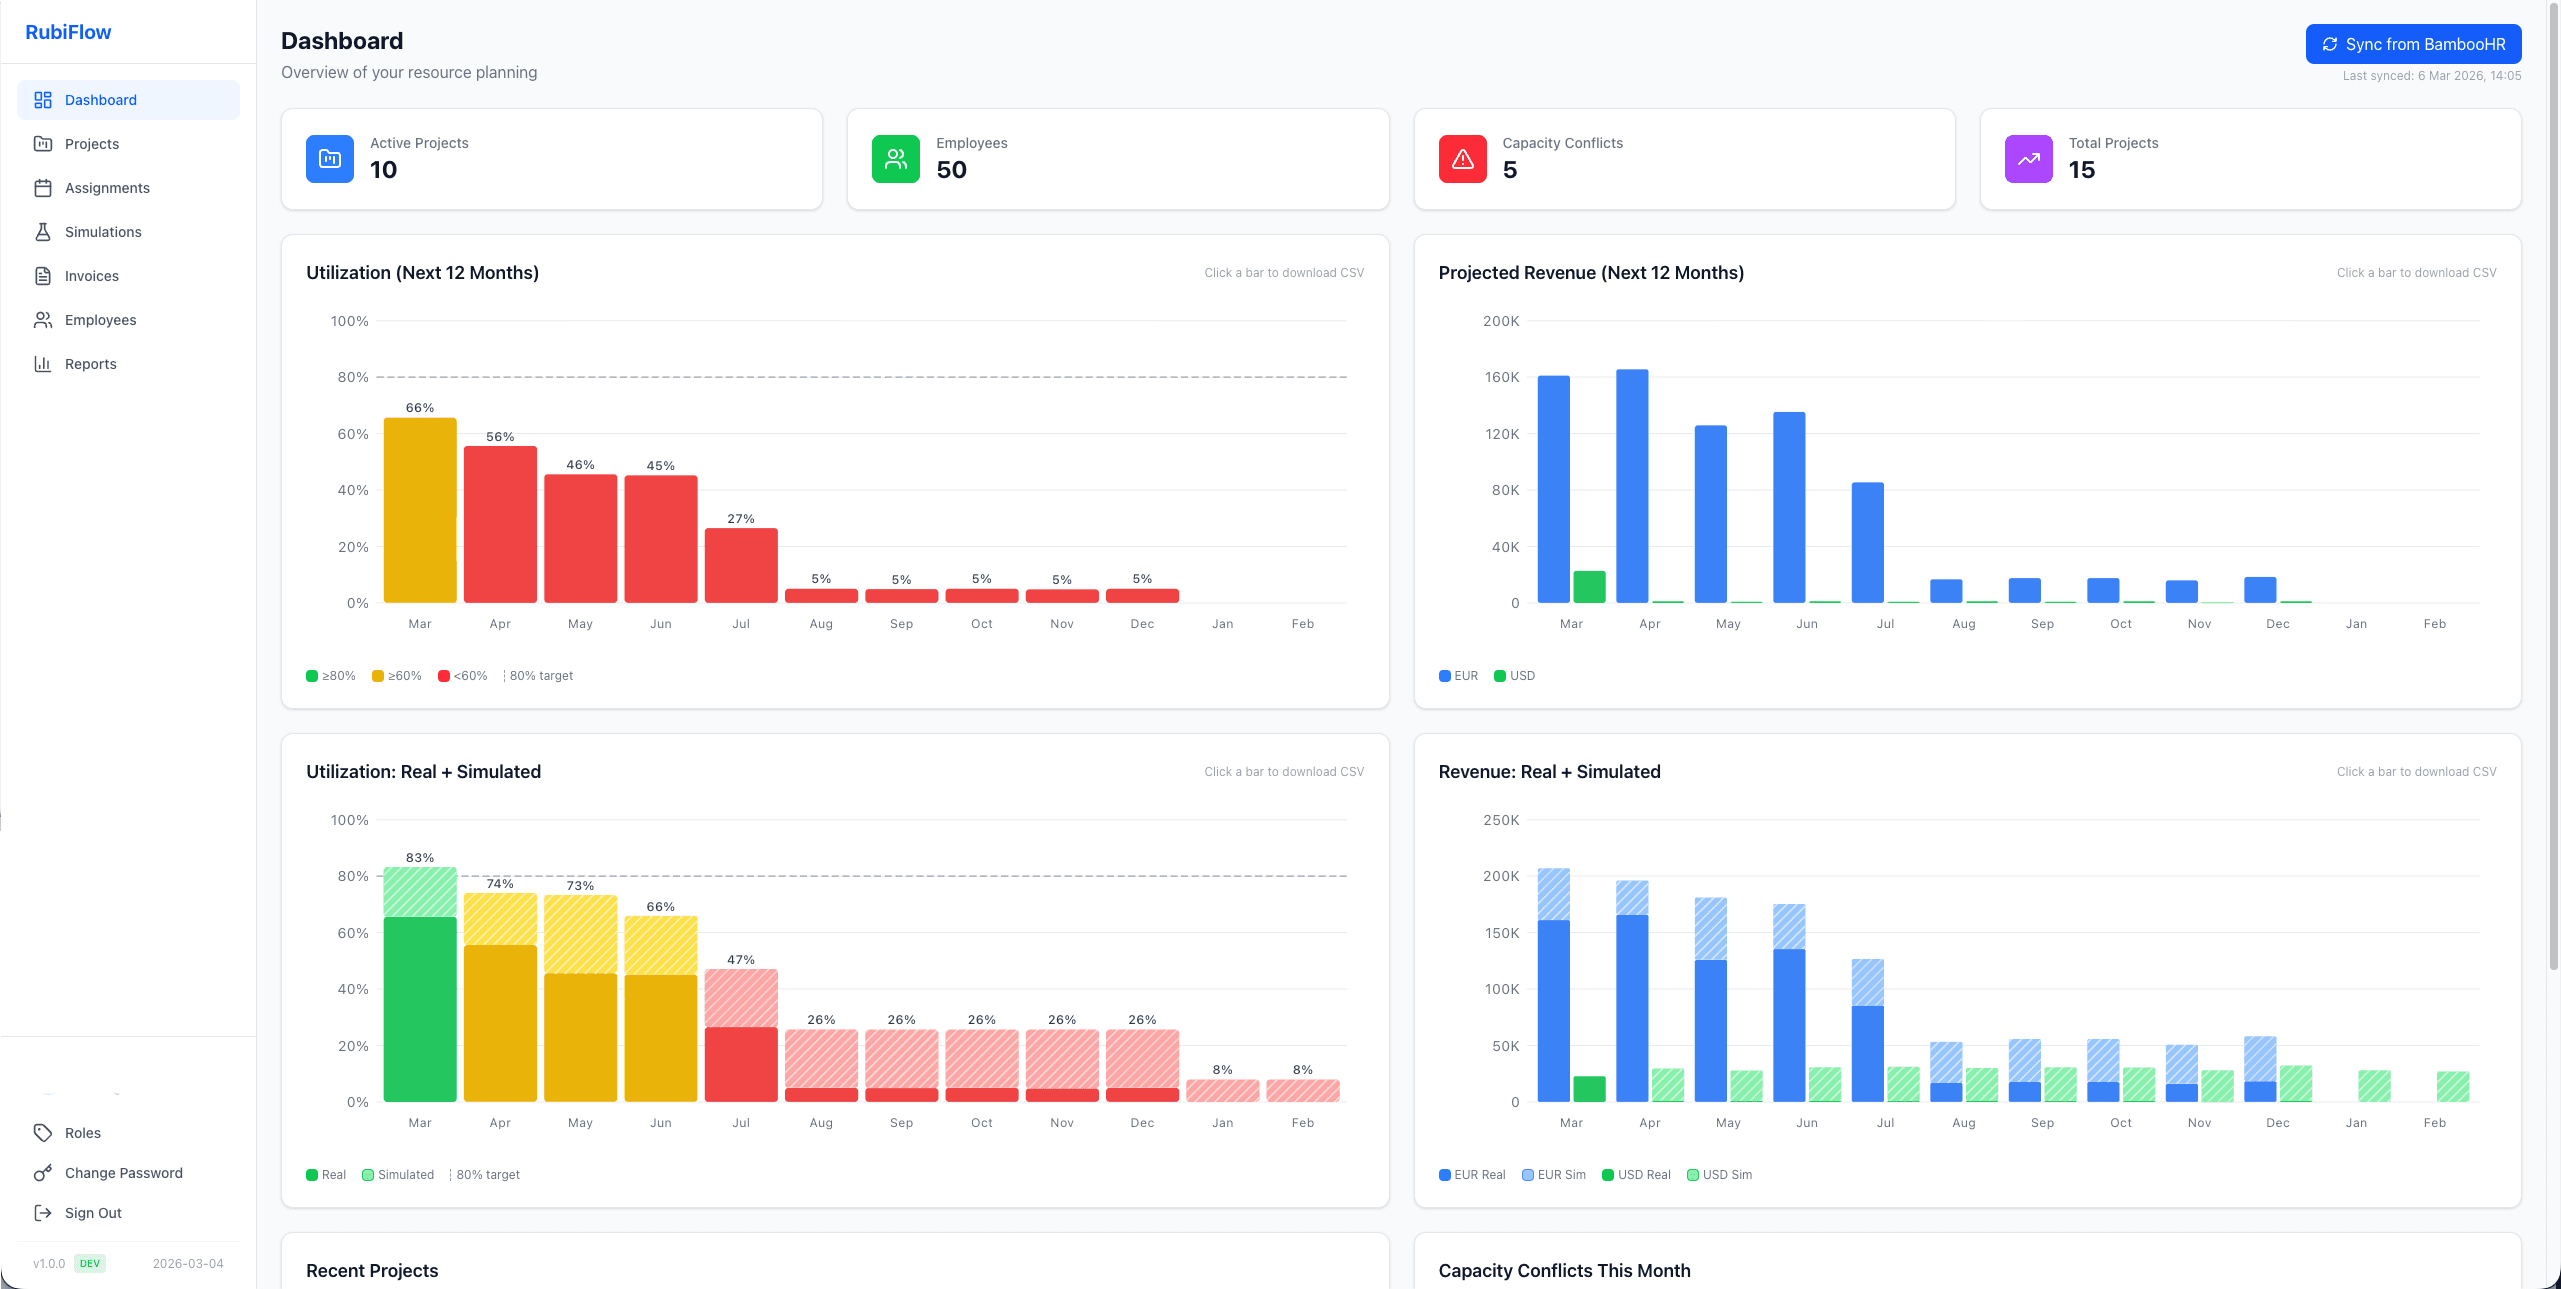
Dashboard & Analytics
Get a bird's-eye view of your entire organization. Utilization charts, revenue projections, and capacity conflict alerts, all updated in real time.
- 12-month utilization forecast with color-coded thresholds
- Projected revenue by currency (EUR/USD) with trend visualization
- Capacity conflict detection across all active projects
- One-click CSV export from any chart
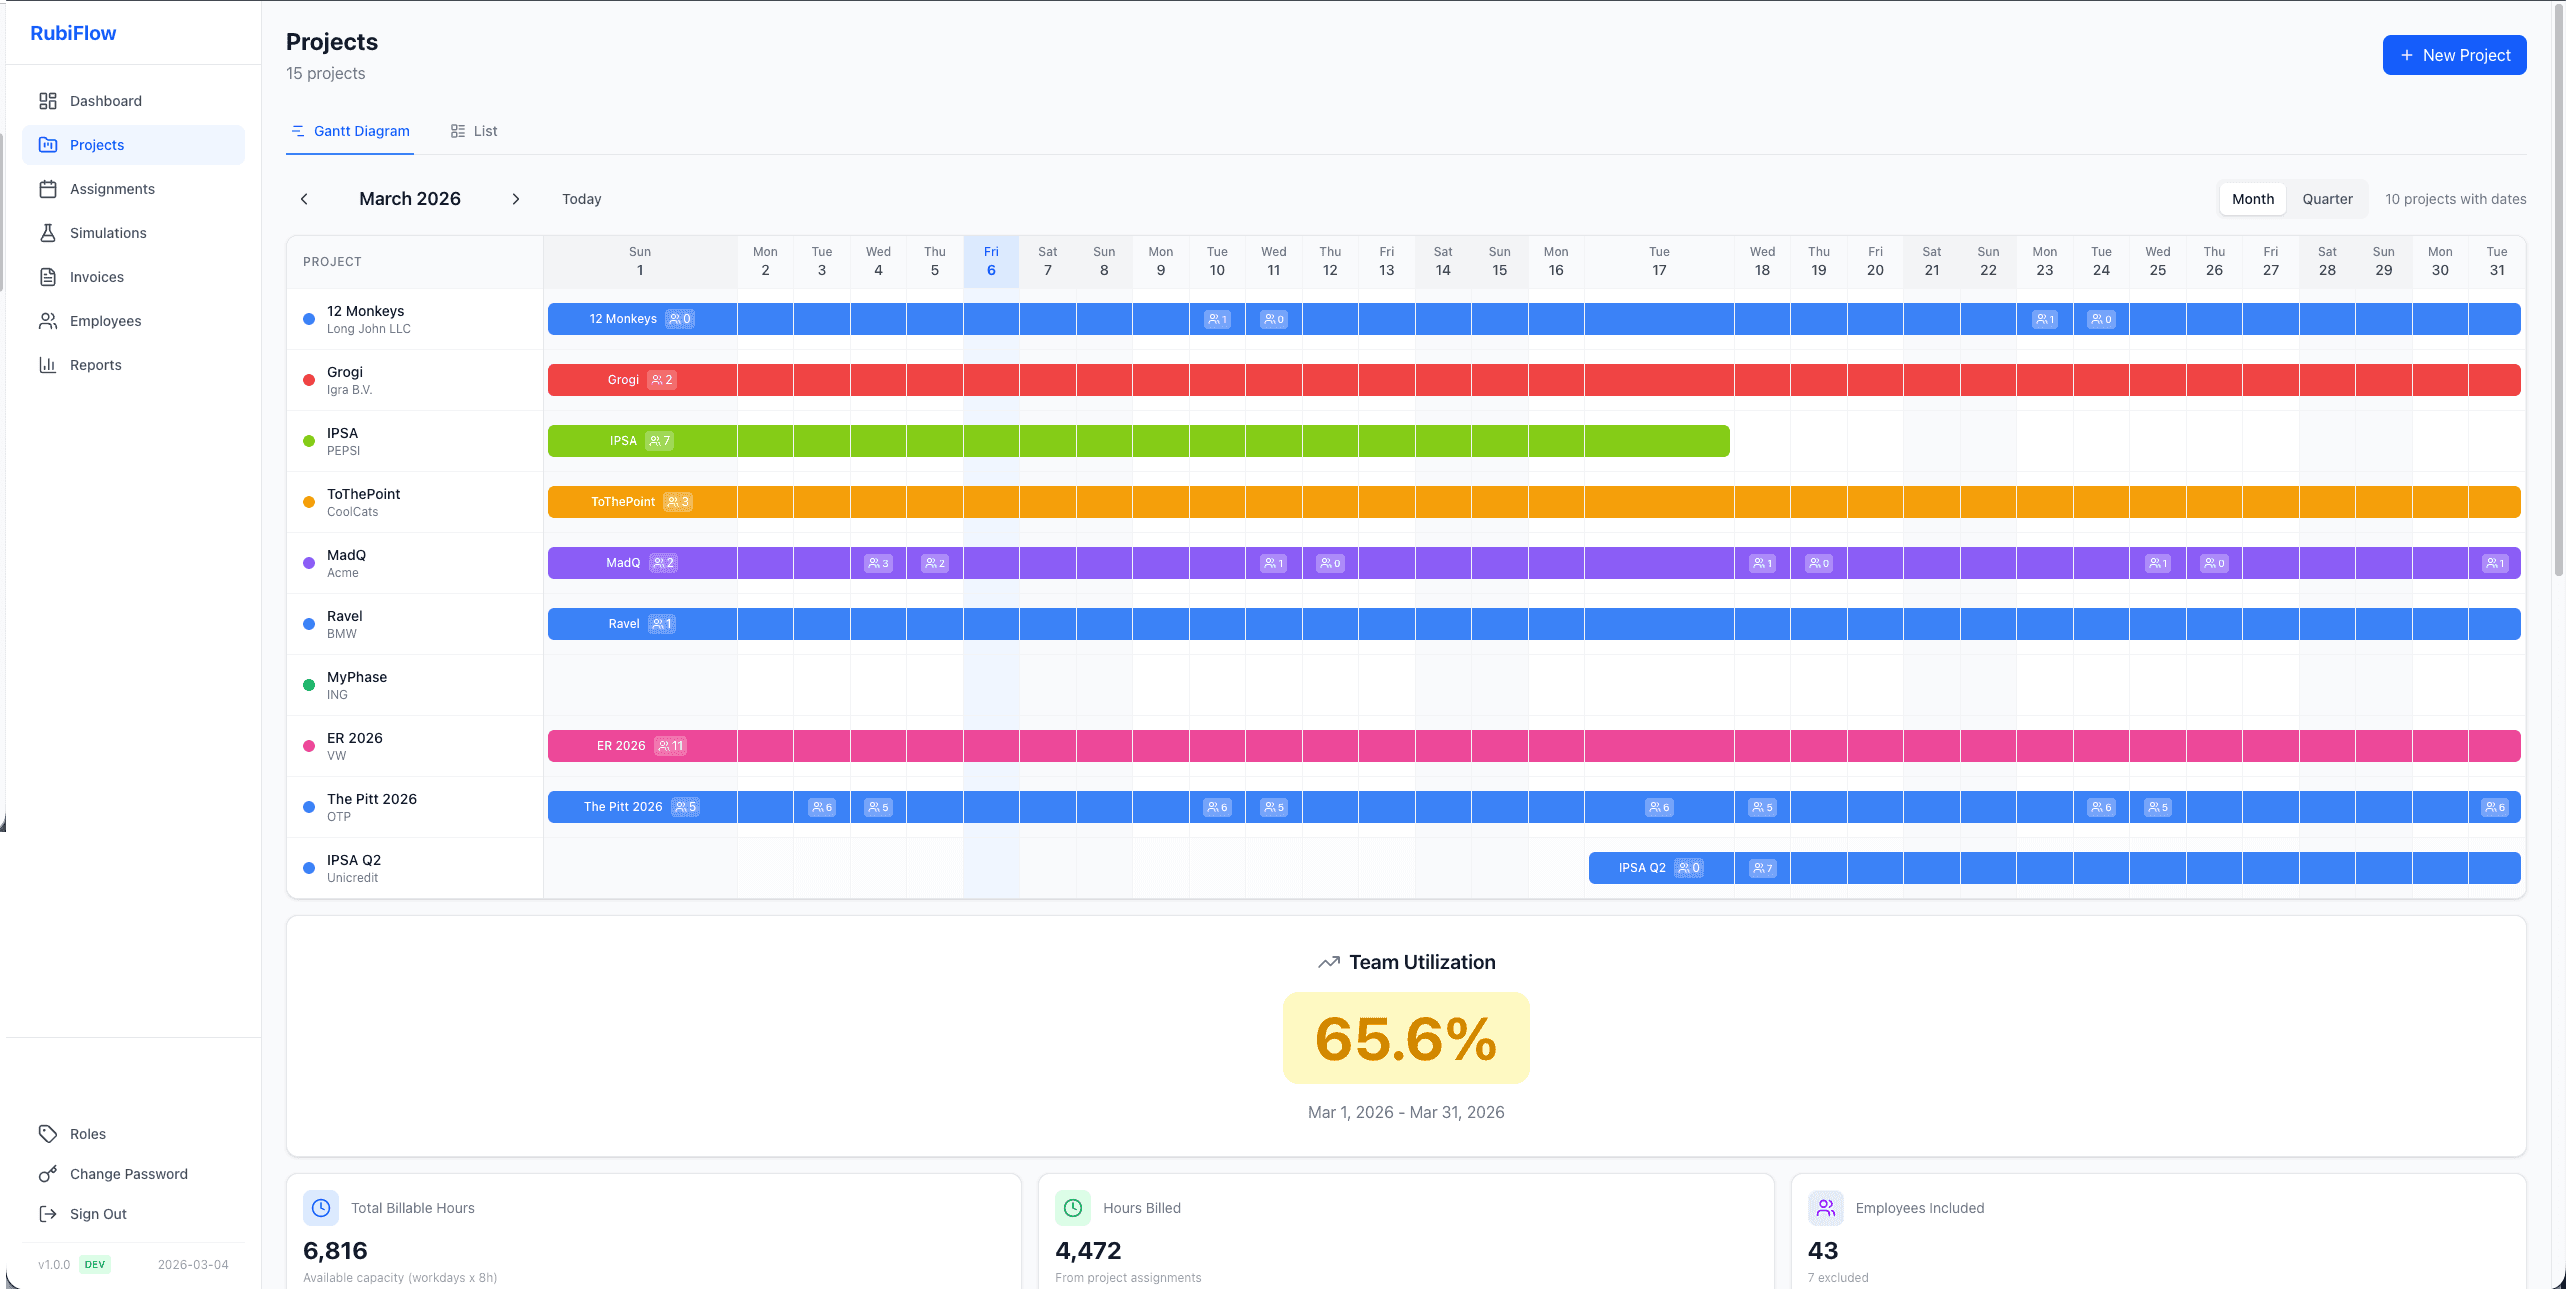
Project Management & Gantt Charts
Visual timeline of every project and assignment. See who's working on what, at a glance. Drag, click, and manage assignments directly from the Gantt view.
- Interactive Gantt with month and quarter views
- Dynamic assignment counts per day on project bars
- Flexible capacity types: every workday, specific days, or total days
- Project cards, table, and Gantt views
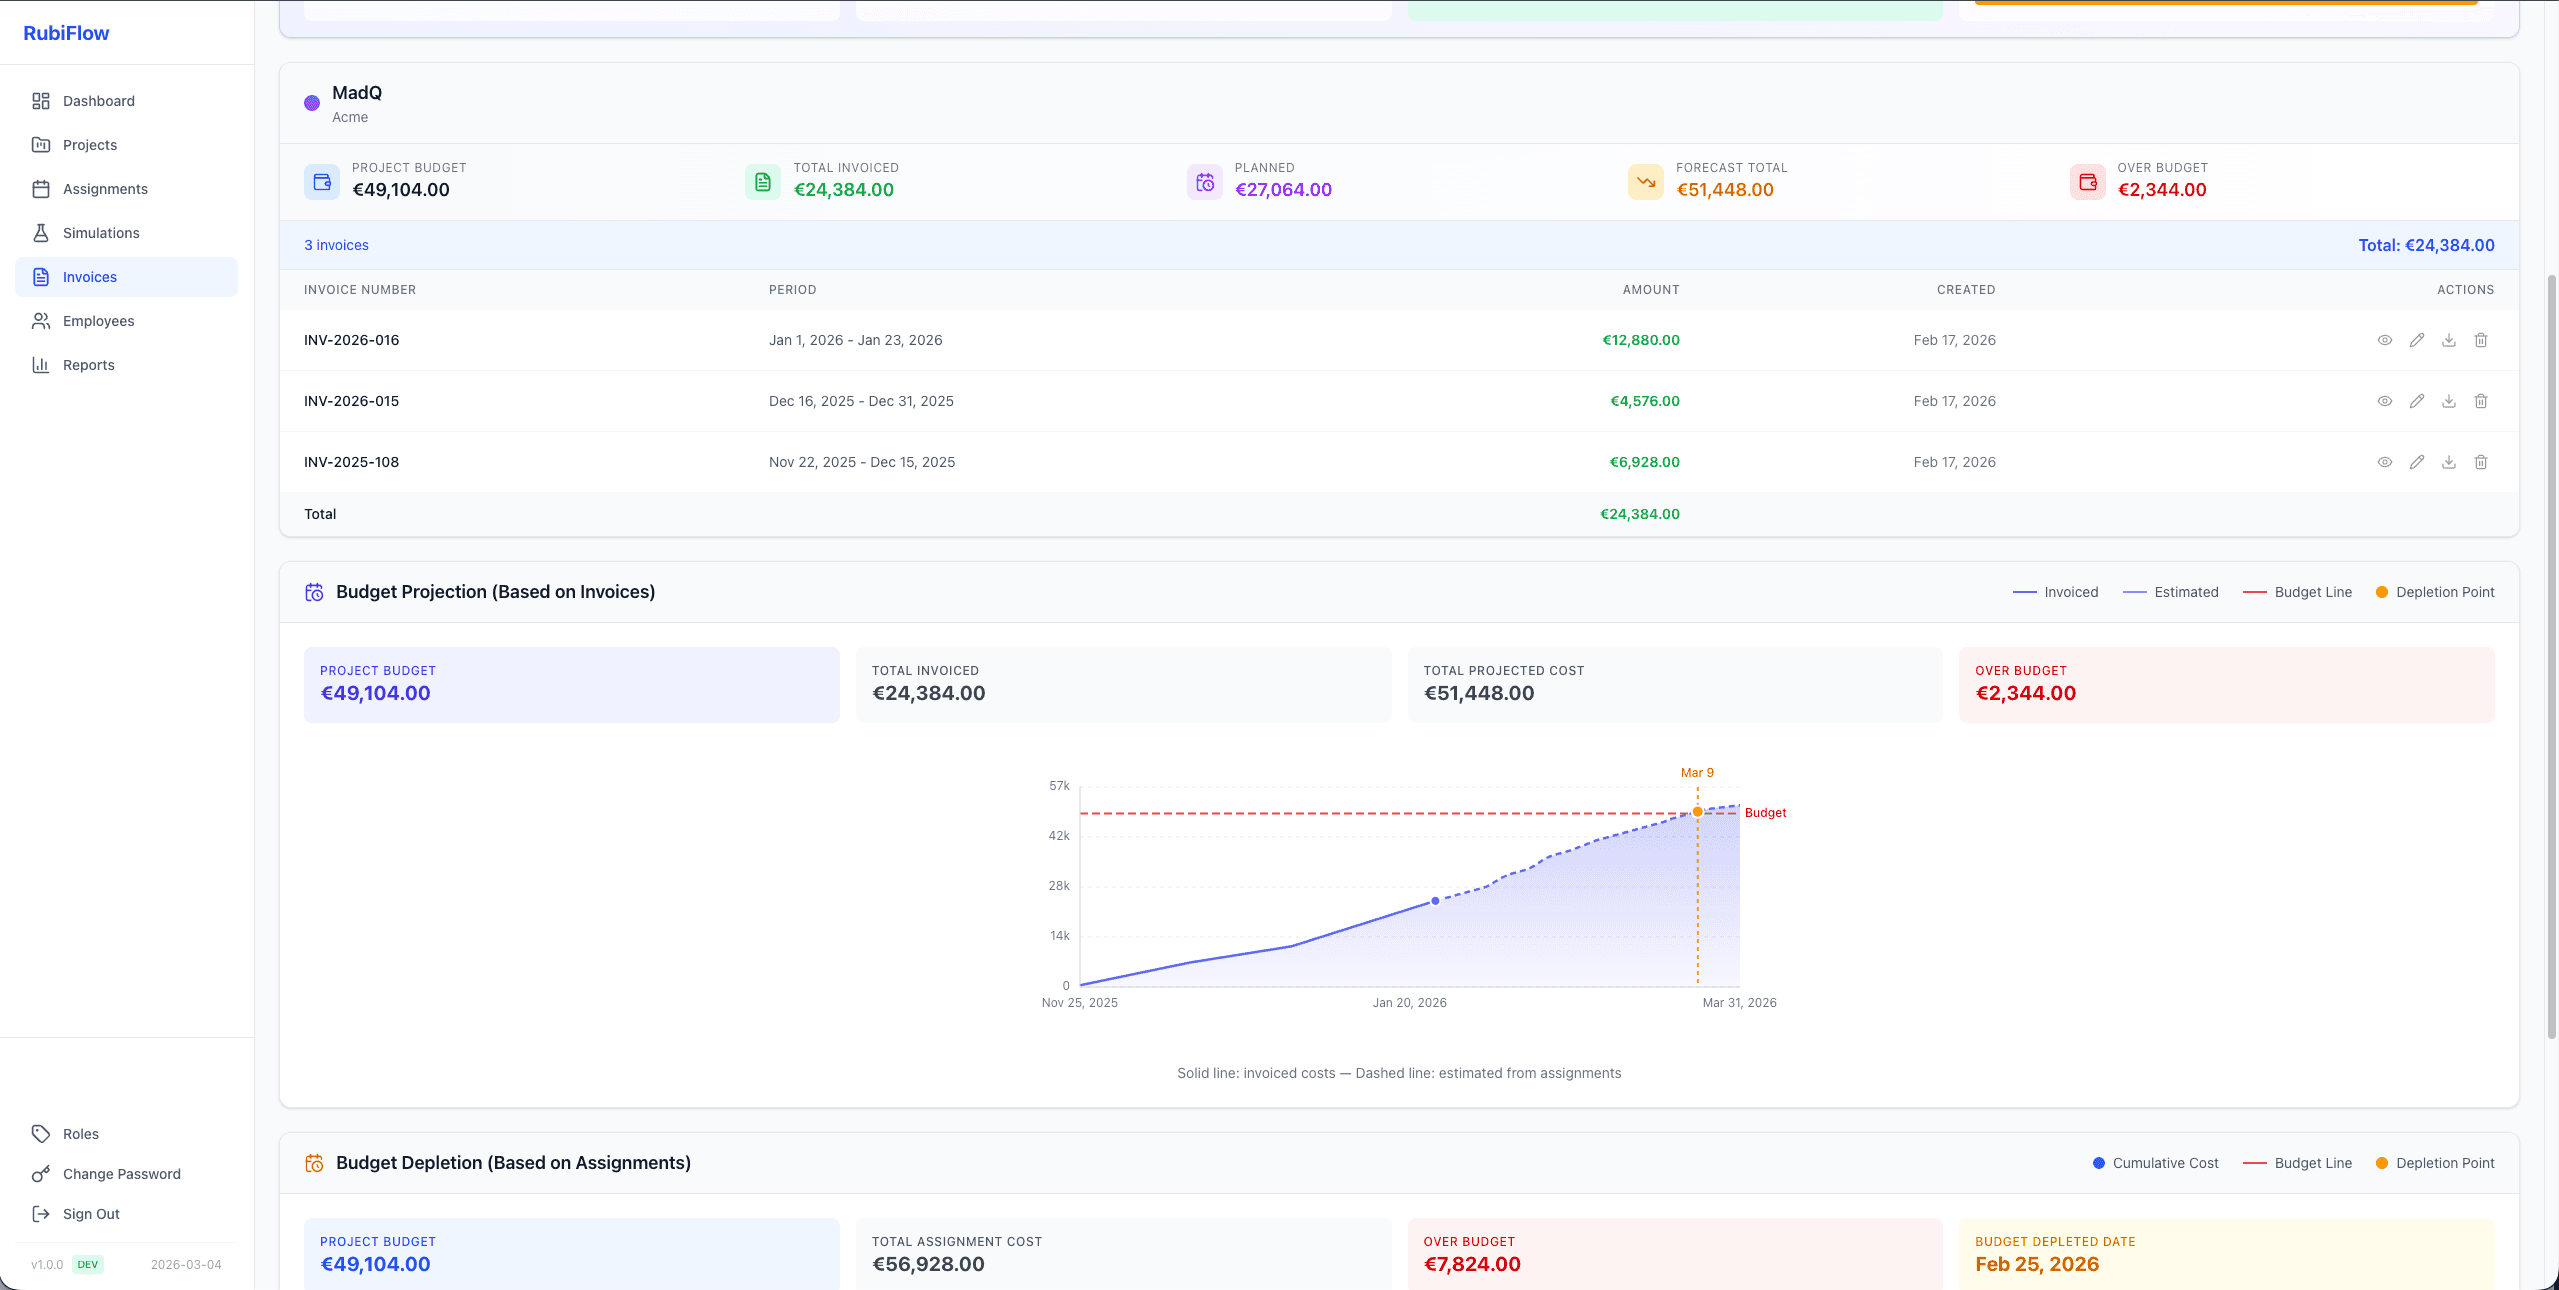
Invoicing & Billing
Generate invoices directly from project assignments. Edit hours on an interactive Gantt, add corrections, track budget depletion, and export to Excel.
- Interactive Gantt for editing billable hours per day
- Automatic billing calculations with rate and currency support
- Budget tracking with depletion and projection graphs
- Additional service items for non-time-entry charges
- Excel export with employee summary and hours matrix
Reporting Suite
Make data-driven decisions with reports that actually matter. Utilization, profitability, billing, and unassigned employee tracking.
- Utilization report with excluded role filtering
- P&L per employee with salary data upload
- Project billing with per-project CSV export
- Unassigned employees with gap tracking
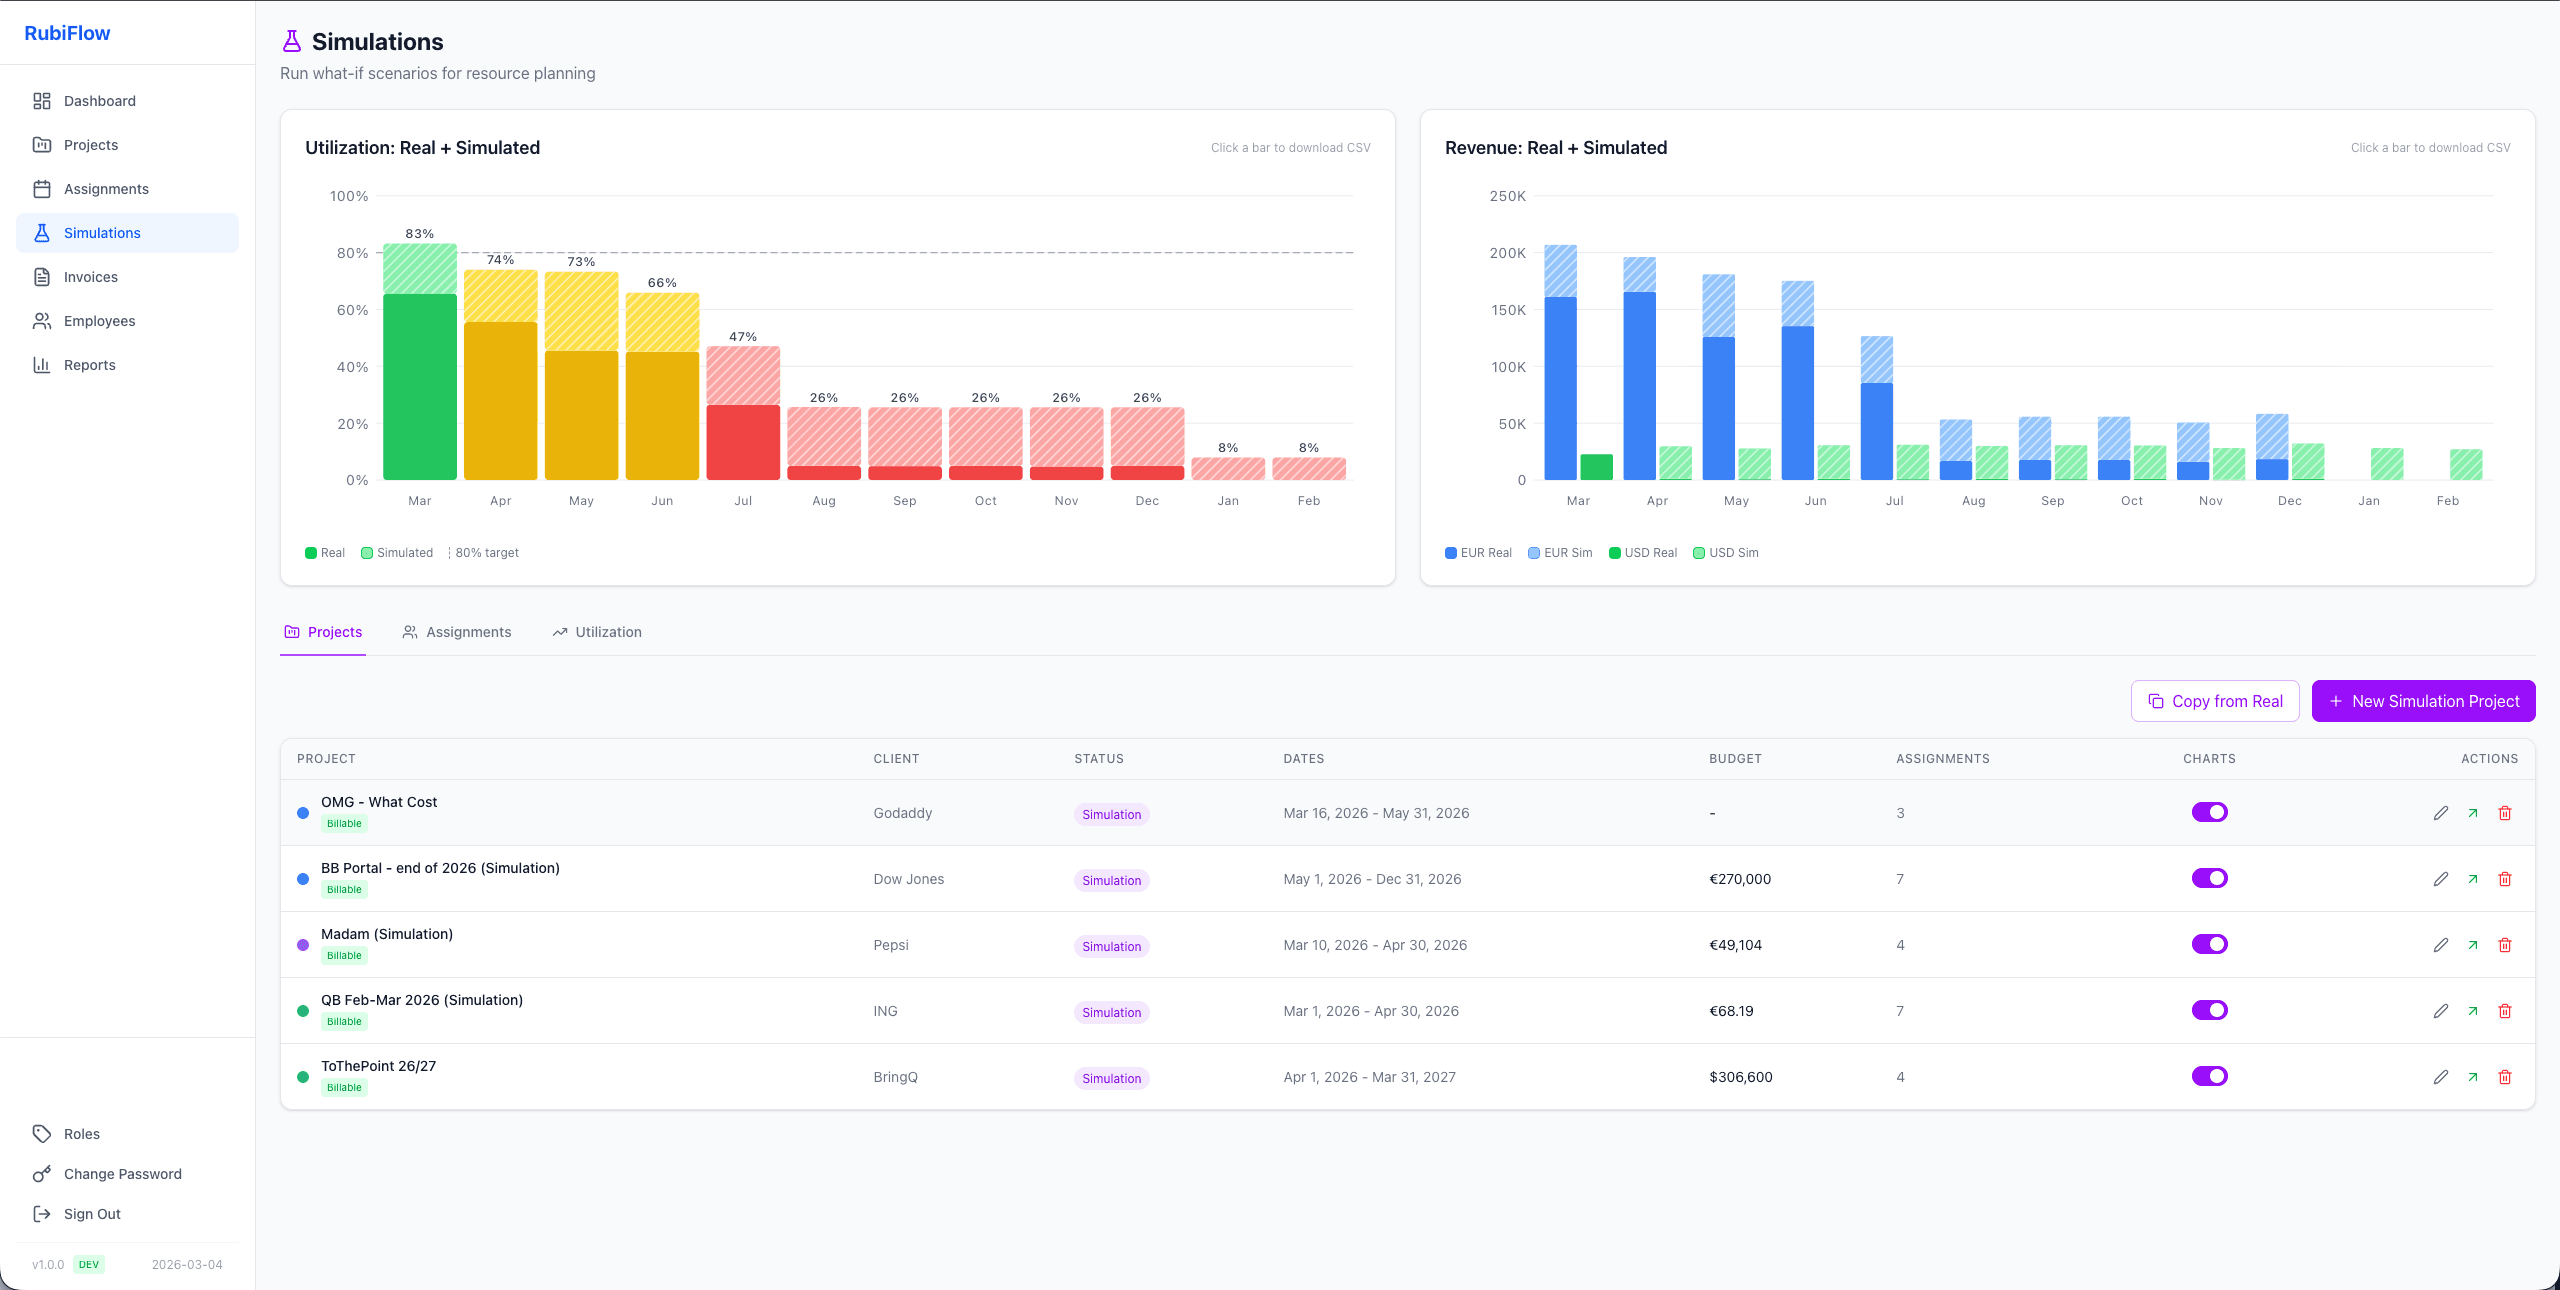
What-If Simulations
Model future scenarios before committing resources. Create simulation projects, assign employees, and see the impact on utilization and revenue without affecting real data.
- Isolated simulation projects and assignments
- Side-by-side real vs. simulated utilization charts
- Per-project toggle for chart inclusion
- One-click promotion from simulation to real project

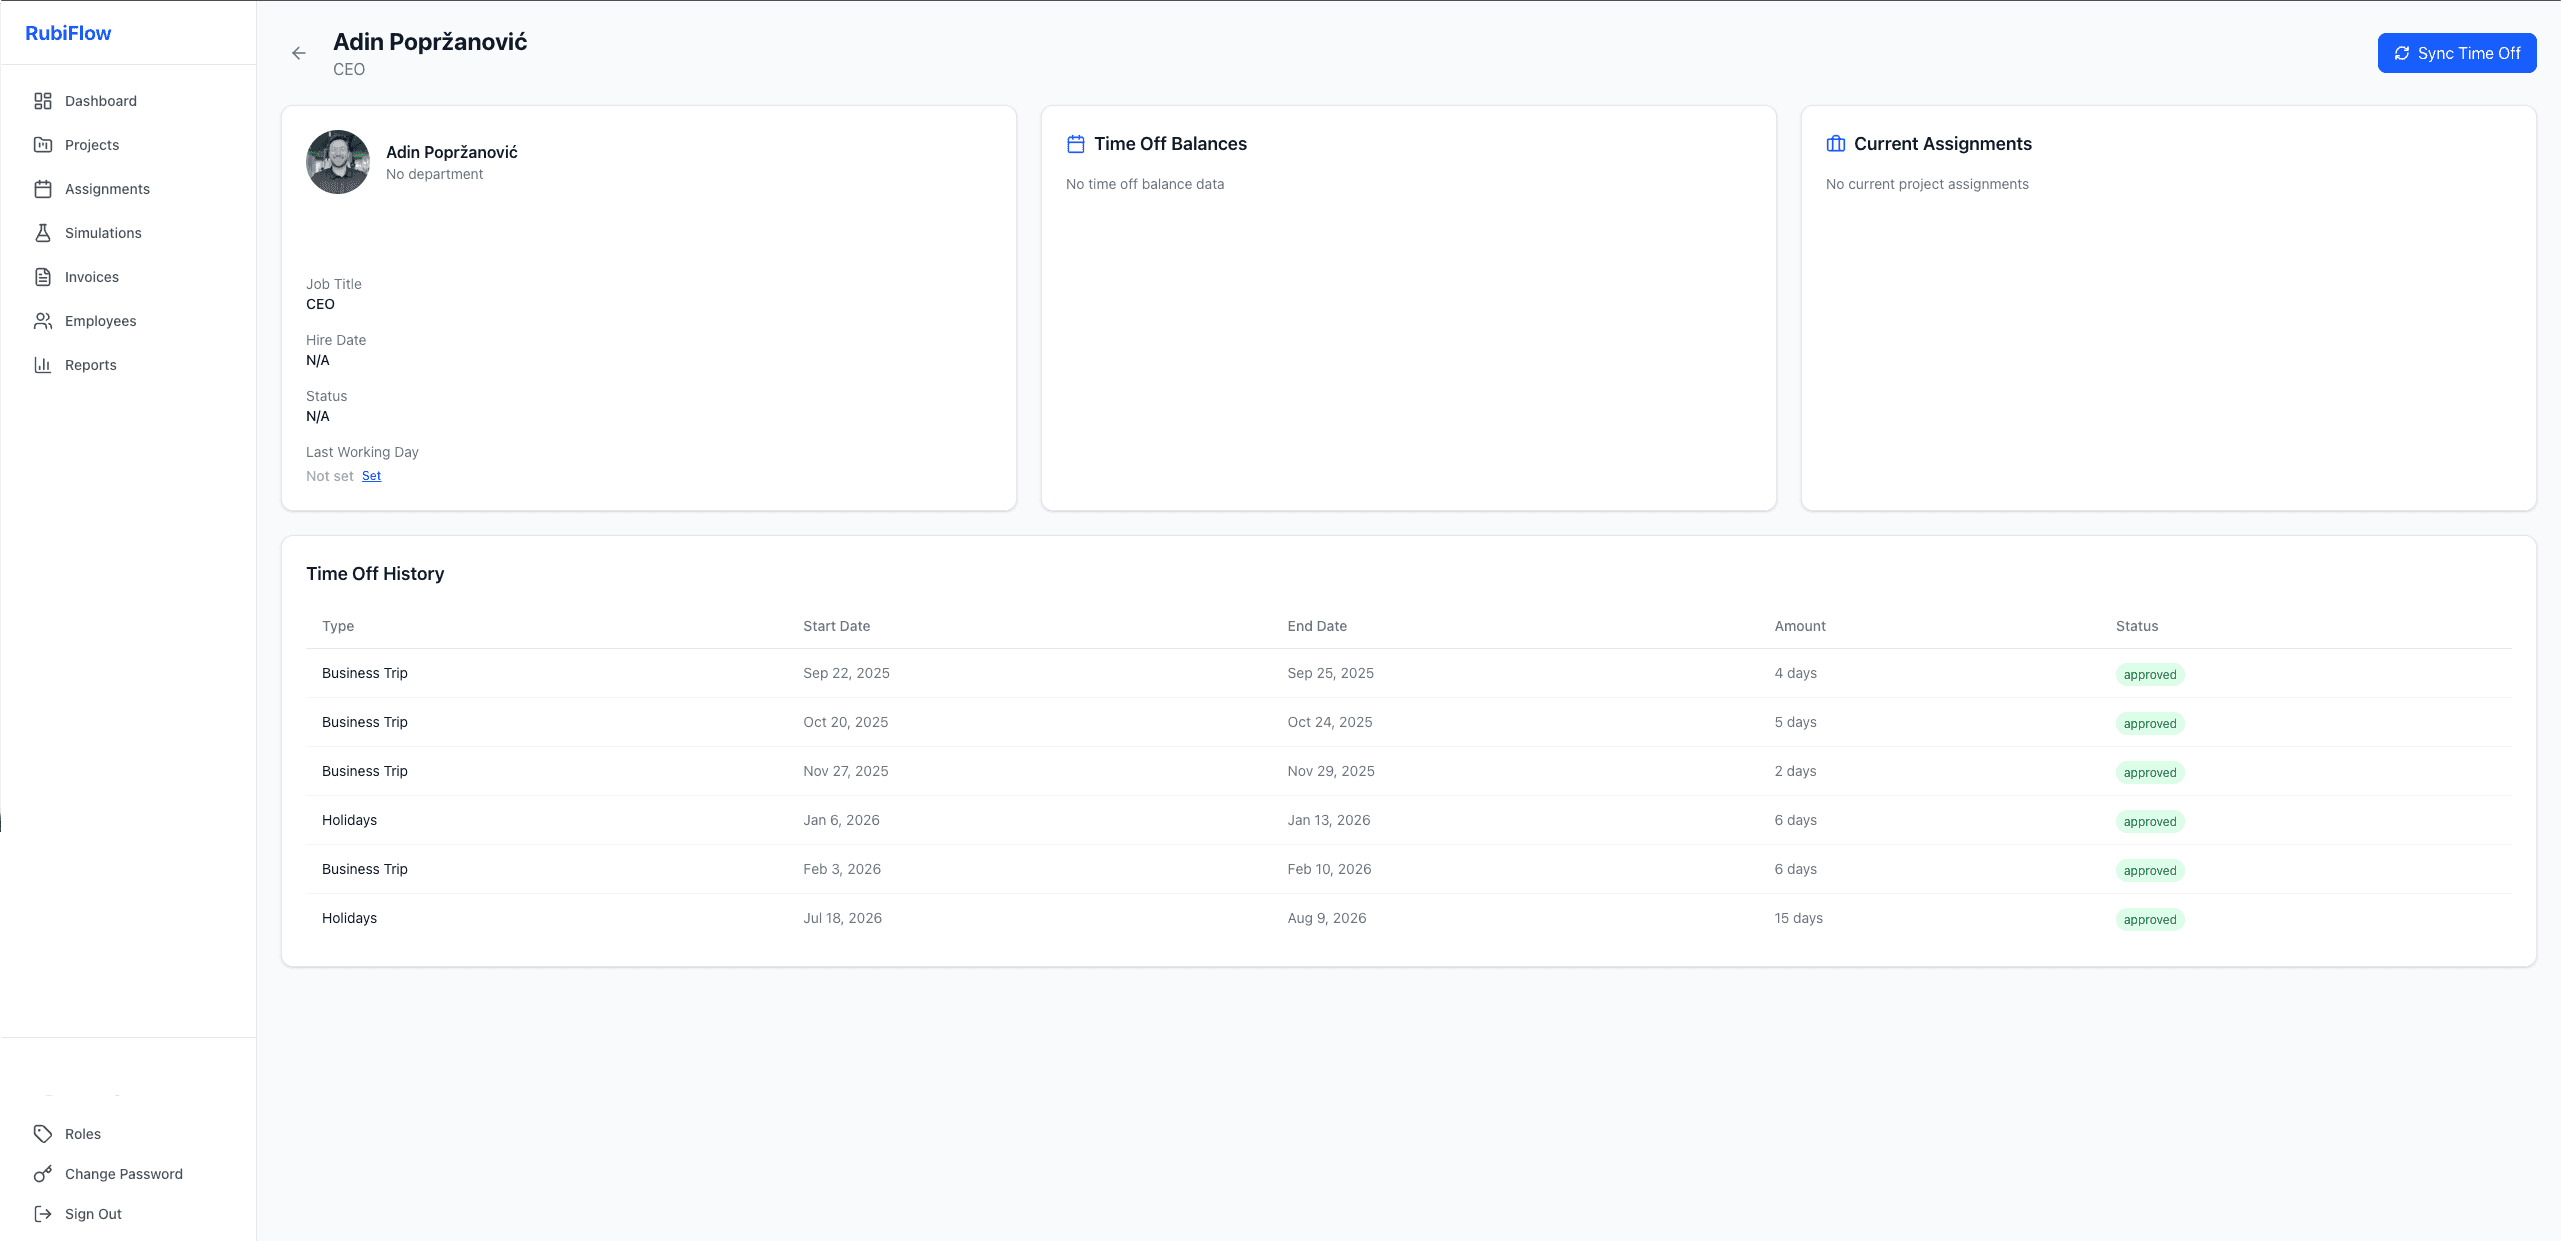
BambooHR Integration
Keep your resource data in sync with your HR system. Employees, time off, holidays, and termination dates flow automatically from BambooHR.
- One-click employee directory sync
- Time off and holiday integration
- Automatic termination date handling
- Employee photos and job titles from BambooHR